Creating a Library Annual Report to Share with Stakeholders

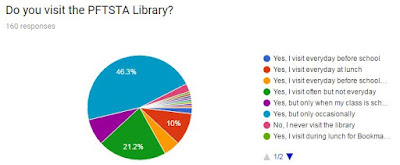
School has been out for a month. I have wanted to create an infographic as a snapshot of the library for 2016-17. After a week long vacation and taking some time off to read and read some more and visit with friends, I sat at the computer yesterday to make the infographic you will find at the end of this post. I used Canva to create it. I only wanted a snapshot that touches a bit on what happened in the library this year because if I tried to cover everything, the reader would lose interest fast. If you want to know more about the PFTSTA Library then you would need to read posts from this blog or follow the library accounts on Facebook , or Instagram . I took information from the report that I had to submit to the district on circulation and number of books. I looked at the stats for our databases and subscriptions and included those. At the end of the year, I sent out a form for students and teachers to give me some feedback about the library. It was mostly very positive. The quot...

